Source: Making sense of the ECG


Step 5 – QRS complex


Always start by confirming the name and date of birth of the patient to confirm the ECG belongs to the right person. Also, confirm the date and time the ECG was performed.
Step 1 – Heart rate
Heart rate can be calculated simply with the following method:
- Work out the number of small squares in one R-R interval
- Then divide 300 by this number and you have your answer
e.g. If there are 4 squares in an R-R interval 300/4 = 75 beats per minute
.

If the rhythm is irregular:
- Count the number of complexes on the rhythm strip (each rhythm strip is 10 seconds long)
- Multiply the number of complexes by 6 (giving you the average number of complexes in 1 minute)
What’s a normal heart rate?
- Normal = 60 – 100 bpm
- Tachycardia > 100 bpm
- Bradycardia < 60 bpm
Hint: If there are obviously P waves present, check the ventricular rate and the atrial rate. The rates will be the same if there is 1:1 AV conduction.
Step 2 – Heart rhythm
The heart rhythm can be regular or irregular.
Irregular rhythms are regularly irregular (i.e. a recurrent pattern of irregularity) or irregularly irregular (i.e. completely disorganised)
Irregular rhythms are regularly irregular (i.e. a recurrent pattern of irregularity) or irregularly irregular (i.e. completely disorganised)
Mark out several consecutive R-R intervals on a piece of paper, then move them along the rhythm strip to check if the subsequent intervals are the same.
Hint – if you are suspicious that there is some atrioventricular block, map out the atrial rate and the ventricular rhythm separately (i.e. mark the P waves and R waves). As you move along the rhythm strip, you can then see if the PR interval changes, if QRS complexes are missing or if there is complete dissociation between the two.
Step 3 – Cardiac axis
Cardiac axis describes the overall direction of electrical spread within the heart
In a healthy individual the axis should spread from 11 o clock to 5 o clock
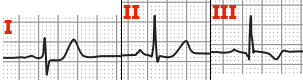
To figure out the cardiac axis you need to look at leads I,II & III
To get a better understanding of cardiac axis read this article
Normal cardiac axis
In normal cardiac axis Lead II has the most positive deflection compared to Leads I & III
Right axis deviation
In right axis deviation Lead III has the most positive deflection & Lead I should be negative
This is commonly seen in individuals with Right Ventricular Hypertrophy

Left axis deviation
In left axis deviation Lead I has the most positive deflection & Leads II & III are negative
Left axis deviation is seen in individuals with heart conduction defects

Step 4 – P waves
Next we look at the p waves & answer the following questions:
- Are P waves present?
- If so, is each P wave followed by a QRS complex?
- Do the P waves look normal? (check duration, direction and shape)
- If not present, is there any atrial activity e.g. sawtooth baseline → flutter waves / chaotic baseline → fibrillation waves / flat line → no atrial activity at all?
Hint – If P-waves are absent & there is an irregular rhythm it may suggest atrial fibrillation.

Step 5 – QRS complex
There are several aspects of the QRS complex to assess.
Width
Width can be described as NARROW (< 0.12ms) or BROAD (> 0.12ms)
- A narrow QRS complex occurs when the impulse is conducted down the bundle of His and the Purkinje fibre to the ventricles. This results in well organised synchronised ventricular depolarisation.
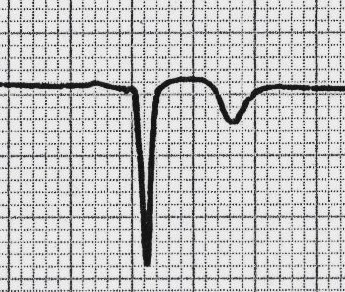
- A broad QRS complex occurs if there is an abnormal depolarisation sequence – for example, a ventricular ectopic where the impulse spreads slowly across the myocardium from the focus in the ventricle. In contrast, an atrial ectopic would result in a narrow QRS complex because it would conduct down the normal conduction system of the heart. Similarly, a bundle branch block results in a broad QRS because the impulse gets to one ventricle rapidly down the intrinsic conduction system then has to spread slowly across the myocardium to the other ventricle.
Height
Describe this as SMALL or TALL:
- Small complexes are defined as < 5mm in the limb leads or < 10 mm in the chest leads.
- Tall complexes imply ventricular hypertrophy (although can be due to body habitus e.g. tall slim people). There are numerous algorithms for measuring LVH, such as the Sokolow-Lyon index or the Cornell index.
Step 6 – ST segment
The ST segment is the part of the ECG between the end of the S wave & start of the T wave.
In a healthy individual it should be an isoelectric line (neither elevated or depressed).
Abnormalities of the ST segment should be investigated to rule out pathology.
ST elevation
ST elevation is significant when it is > 1mm (1 small square) in relation to the baseline.
It is most commonly caused by acute myocardial infarction.
The morphology of the ST elevation differs depending on how long ago the MI occurred.

ST depression
ST depression is significant when it is >1mm (1 small square) in relation to the baseline.
ST-depression lacks specificity, therefore you shouldn’t jump to any diagnostic conclusions.
It can be caused by many different things including:
- Anxiety
- Tachycardia
- Digoxin toxicity
- Haemorrhage, Hypokalaemia, Myocarditis
- Coronary artery insufficiency
- MI
As a result you must take this ECG finding & apply it in the context of your patient.

Step 8 – T waves
The T waves represent repolarisation of the ventricles.
Tall T waves
T waves are tall if they are:
- > 5mm in the limb leads and
- > 10mm in the chest leads (the same criteria as ‘small’ QRS complexes).
Tall T waves can be associated with:
- Hyperkalaemia (“Tall tented T waves”)
- Hyper-acute STEMI

Inverted T waves
T waves are normally inverted in V1 and inversion in lead III is a normal variant.
Inverted T waves in other leads are a nonspecific sign of a wide variety of conditions:
- Ischaemia
- Bundle branch blocks (V4 – 6 in LBBB and V1 – V3 in RBBB)
- PE
- LVH (in the lateral leads)
- HCM (widespread)
- General illness
Around 50% of ITU admissions have some evidence of T wave inversion during their stay.
Comment on the distribution of the T wave inversion e.g. anterior / lateral / posterior leads.
You must take this ECG finding & apply it in the context of your patient.
Biphasic T waves
Biphasic T waves have two peaks and can be indicative of ischaemia and hypokalaemia.
Flattened T waves
Another non-specific sign, this may represent ischaemia or electrolyte imbalance.
U waves
Not a common finding.
The U wave is a > 0.5mm deflection after the T wave best seen in V2 or V3.
These become larger the slower the bradycardia – classically U waves are seen in various electrolyte imbalances or hypothermia, or antiarrhythmic therapy (such as digoxin, procainamide or amiodarone).

Prominent U waves in a patient with Hypokalaemia 5
Summary
Having a system whilst working through ECGs is essential until you gain the experience required to start using pattern recognition to speed up the process.
No comments:
Post a Comment